Urban Metabolism
Cities breathe, circulate, and decay. We measured how.
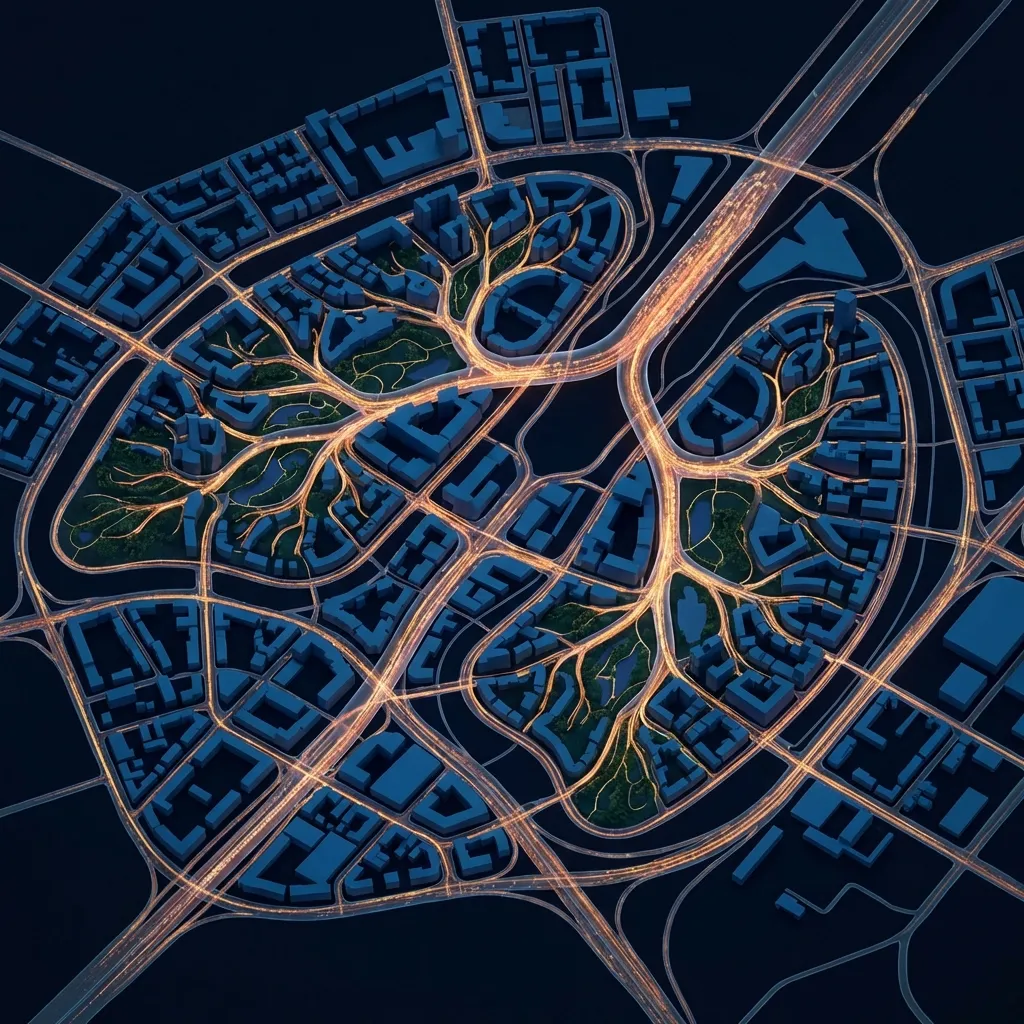
A city is not a machine. It's an organism.
This isn't poetry. It's observable fact. Cities have circulation systems (transit), nervous systems (street life), organs (neighborhoods), and immune responses (planning). When these systems fail, the whole organism suffers.
We spent three years studying five cities through this biological lens. Tokyo, with its 300 kilometers of metro lines. Copenhagen, where 60% of trips happen by bike or foot. Istanbul, 2,500 years old and still functioning. London, the original industrial metropolis. And Ankara, our case study in what happens when a city grows without a plan.
The findings were stark. Ankara expanded 68% in twenty years while adding almost no public transit. The result? Water shortages every summer. Power grid failures. Neighborhoods where nobody knows their neighbors. A city that grew but didn't develop.
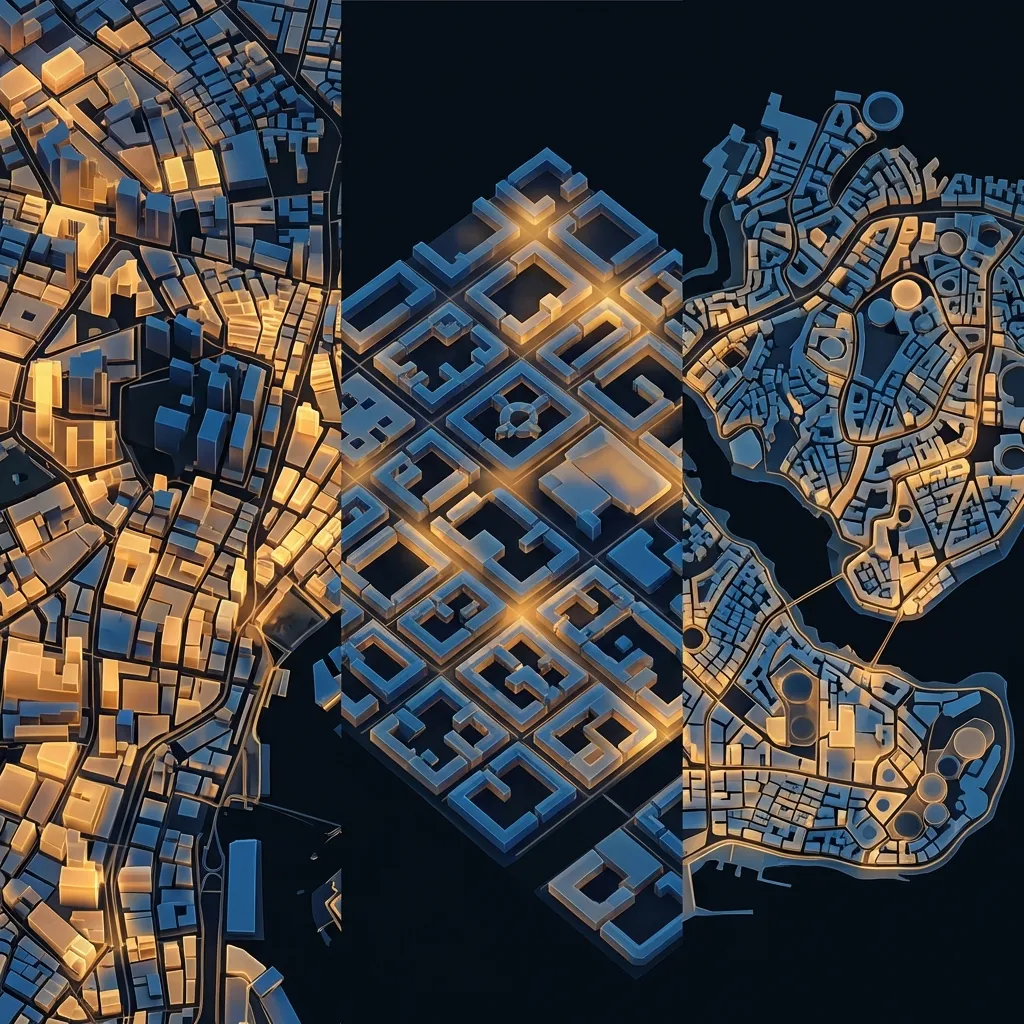
Five Cities, Five Metabolisms: Transit density, street activity, and neighborhood identity across Tokyo, Copenhagen, Istanbul, London, and Ankara.
Theoretical Framework
Circulation
How people and goods move through the city. Metro lines, bus networks, bike lanes. When circulation fails, everything clogs.
Nervous System
The informal encounters that make urban life rich. Neighbors chatting, strangers nodding, kids playing. Streets without people are dead nerves.
Organs
Distinct neighborhoods with their own character. Shibuya feels different from Shinjuku. Kadikoy feels different from Besiktas. Healthy cities have organs. Sick cities are uniform.
Skin
The boundary between private and public. Active ground floors, permeable facades, eyes on the street. Good skin invites interaction.
Immune System
Planning and regulation. Does the city catch problems early, or let them metastasize? Infrastructure-first is healthy. Sprawl-first is cancer.
Research Process
Define the Organism
We established five biological systems to measure: circulation, nerves, organs, skin, immune response
Gather the Data
Twenty years of GIS records, transit data, census figures, and satellite imagery across five cities
Map the Systems
Translated urban data into metabolic indicators. Transit coverage became arterial health. Street activity became neural activity.
Compare and Diagnose
Cross-referenced cities to identify what separates healthy urban organisms from sick ones
Research Phases
City Selection
We chose five cities representing different urban philosophies: Tokyo (density), Copenhagen (sustainability), Istanbul (organic growth), London (industrial legacy), Ankara (sprawl).
Data Collection
Twenty years of GIS data, transit records, demographic surveys, and satellite imagery. For Ankara, we also conducted field interviews.
Metabolic Mapping
Translating raw data into biological metaphors. Transit lines as arteries. Pedestrian zones as active tissue. Dead zones as necrosis.
Comparative Analysis
What separates thriving cities from struggling ones? We identified four key indicators that predict urban health.
Key Metrics
Key Thinkers
Jan Gehl
Gehl spent fifty years counting pedestrians. His Copenhagen street studies proved that walkable cities aren't just nice, they're economically and socially essential. Our metrics for 'street life' build directly on his methods.
Archigram
Peter Cook and his collaborators imagined cities as living machines. Their 'Plug-In City' drawings were provocations, but the underlying idea was serious: cities should adapt like organisms.
Ebenezer Howard
Howard invented the Garden City, the first systematic attempt to plan healthy urban growth. His principle was simple: infrastructure first, buildings second. Ankara did the opposite.
Jane Jacobs
In 1961, Jacobs showed that healthy neighborhoods need mixed use, short blocks, and old buildings. Tokyo has all three. Ankara's new districts have none.
Case Studies
Ankara: The Full Autopsy
TurkeyFrom 2005 to 2025, Ankara added 1.2 million residents and almost no public transit. The city expanded 68% by area while metro coverage stayed flat. The consequences: 40-80 days of water rationing each summer, chronic power deficits, and neighborhoods so car-dependent that residents can't walk to buy bread.
Tokyo: The Functioning Giant
Japan37 million people in one metropolitan area, yet it works. The secret? Density plus transit. Tokyo has 300 km of metro, trains every two minutes at rush hour, and neighborhoods that kept their identities despite modernization. Shibuya, Shinjuku, Ginza: each feels like a different city.
Copenhagen: The Human Scale
DenmarkEurope's most livable city didn't happen by accident. In the 1960s, Copenhagen closed its main street to cars. Critics predicted disaster. Instead, foot traffic tripled. Today, 60% of trips in Copenhagen happen by bike or foot. The result: lower healthcare costs, cleaner air, and streets where people actually talk to each other.
Comparative Analysis
Tokyo
Complexity That Works23 named wards, each with distinct character. 300 km of metro. Trains every 2-3 minutes. Villages merged into the city but kept their names and identities.
Copenhagen
The Human City60% of trips by bike or foot. Stroget, Europe's longest pedestrian street. Parks within 300 meters of every home. Small, intentional, livable.
Istanbul
Organic Survival2,500 years of continuous habitation. Byzantine street patterns still in use. The Bosphorus naturally limits sprawl. Chaotic but alive.
Ankara
The WarningOne metro line for 5.5 million people. 68% expansion in twenty years. Infrastructure built after the fact, if ever. This is what not to do.
Optimization Results
Kilometers of metro line per million people. Think of this as arterial health.
Key Findings
Transit density predicts almost everything. Tokyo has 45 times more metro per capita than Ankara. That single number explains most of the difference in quality of life.
45× gapStreet life is measurable. Copenhagen has 60% active streets, Ankara has 15%. Dead streets don't just feel bad. They correlate with higher depression, lower social trust, and worse health outcomes.
4× differenceNeighborhood identity matters. In Tokyo, each ward has a name, a personality, a reason to exist. In Ankara's new districts, everything looks and feels the same. Anonymity breeds alienation.
92 vs 28Infrastructure-first works. Copenhagen and Tokyo both followed Howard's Garden City principle: build the transit, then build the buildings. Ankara built the buildings first. The transit never came.
Proven patternHonest Limitations
Five cities isn't a large sample. We see patterns, but we can't claim statistical certainty.
Our metrics for 'street life' and 'neighborhood identity' involve judgment calls. Others might score differently.
Twenty years of Ankara data is substantial, but urban change happens over centuries. We're seeing a snapshot.
Istanbul works despite chaos. Some cities break the rules and thrive. We don't fully understand why.
Where This Led
This research directly shaped our approach to district planning. The metabolic framework now informs how we evaluate sites for Archly.ai users. We also developed a set of Ideal City Planning Assets: 3D models based on Copenhagen's density and Tokyo's transit logic.
Conclusion
Cities are organisms. They have circulation, nervous systems, organs, and immune responses. When these systems work together, urban life thrives. When they don't, cities become collections of buildings where no one wants to live. Ankara taught us what failure looks like. Tokyo and Copenhagen showed us what's possible.
Limitations
- Five-city sample
- Ankara focus may not generalize
Future Directions
- Expand to 15+ cities
- Real-time metabolic monitoring
- Policy recommendation engine